As an Amazon Associate, Akermin earns from qualifying purchases. Product links on this page are affiliate links.
Record often enough to capture the fastest change you need to see, and no more often than that. Room temperature and humidity move over tens of minutes, so 10 to 15 minute intervals are usually right. CO₂ in an occupied room moves over minutes, so 1 to 5 minutes. Freezer door openings and equipment faults last seconds to minutes, so 1 minute or less. Every halving of the interval doubles memory use and shortens battery life, and it does not improve accuracy.
How fast each quantity changes
| Quantity | Typical timescale of change | Suggested interval |
|---|---|---|
| Room air temperature | Tens of minutes to hours | 10 to 15 min |
| Fridge / freezer temperature | Minutes (door events), hours (cycles) | 1 to 5 min |
| Relative humidity in a room | Minutes (showers) to hours | 5 to 10 min |
| CO₂ in an occupied room | Minutes | 1 to 5 min |
| PM2.5 during cooking | Seconds to minutes | 10 s to 1 min |
| Outdoor weather | Minutes to hours | 5 to 10 min |
| Radon | Hours; readings need long averages | 1 hour (device-determined) |
| Soil temperature | Hours to days | 30 to 60 min |
The costs of going faster
- Memory. A 32,000-reading logger lasts 22 days at 1 minute, 222 days at 10 minutes.
- Battery. Each measurement wakes the sensor; NDIR CO₂ sensors in particular draw a burst. A battery CO₂ monitor may last four years at 10 minutes and one year at 1 minute.
- Data handling. A year at 1 minute is half a million rows per channel. Analysis and charts slow down, and the extra points rarely add information for slow quantities.
The cost of going slower
Aliasing. If a freezer door opens for three minutes every hour and the logger samples every 15 minutes, most events are missed and the ones caught look random. If a meeting room fills at 9:00 and empties at 9:45, a 30-minute interval might record one point in the middle and miss the peak. The rule of thumb from signal processing is to sample at least twice as fast as the fastest change that matters, and in practice five to ten times faster gives a curve you can read.
Instantaneous versus averaged samples
Some loggers record the instantaneous value at each interval; others average the readings since the last sample. Averaging smooths noise and captures energy over the interval (useful for temperature in a cold chain) but blurs short spikes. Instantaneous sampling preserves spikes but is noisier. For particle sensors, whose readings jump, a 1-minute average is generally more useful than a 1-second sample.
Practical settings
- Start with the interval from the table.
- Check memory and battery against the planned duration; lengthen the interval if either falls short.
- For a diagnostic survey (why is this room damp?), use a short interval for a week, then a longer one for ongoing monitoring.
- Use alarm thresholds rather than a very short interval to catch excursions; many loggers record extra points when a threshold is crossed.
Loggers and their interval ranges are described in what an environmental data logger is; for CO₂ monitor sampling settings, see how fast a CO₂ monitor should respond.
Recommended Tools

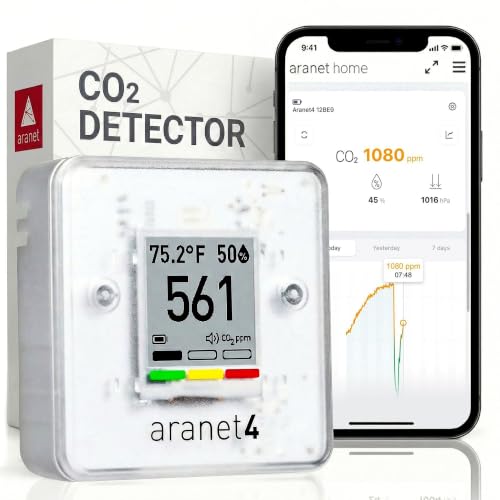
Products shown because their documented specifications fit this guide. Price and availability are on Amazon and can change.
Frequently Asked Questions
What logging interval should I use for temperature and humidity?
Ten to fifteen minutes for rooms and storage; one to five minutes for fridges, freezers and incubators where short excursions matter.
What interval for CO₂?
One to five minutes for occupied rooms, because levels change on that timescale. Ten minutes is acceptable for long-term surveys and gives years of battery on some monitors.
Does a shorter interval improve accuracy?
No. It improves time resolution. Accuracy is a property of the sensor. Averaging several fast readings can reduce noise, which is a different thing.
Affiliate disclosure: Akermin earns a commission from qualifying Amazon purchases made through links on this page. Our editorial picks are based on documented specifications and owner feedback, not commissions.