As an Amazon Associate, Akermin earns from qualifying purchases. Product links on this page are affiliate links.
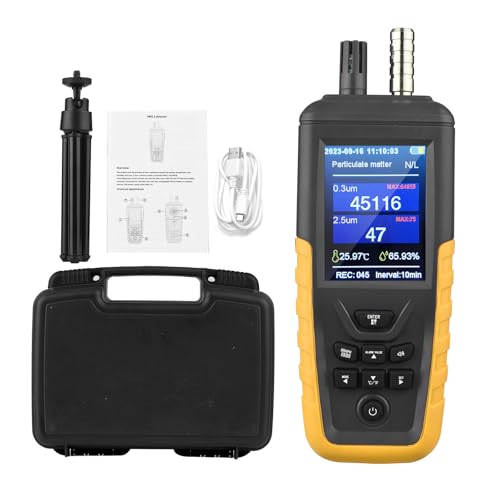
WapoRich · WapoRich Laser Particle Counter, PM2.5 PM10 Dust Particle Meter 3-Channel | Air Quality Pollution Monitor Detects 0.3/2.5/10 μm, Temp & Humidity, with 999 Data Records & Export, USB Rechargeable
View on AmazonPrice and availability are shown on Amazon and can change at any time.
A three channel laser particle counter reading 0.3, 2.5 and 10 micron particles up to 2,000,000 per litre, with PM2.5 and PM10 mass concentration from 0 to 1000 micrograms per cubic metre at a stated accuracy of plus or minus 12 and a resolution of 1, plus temperature, 999 stored records with adjustable intervals, on screen trend curves, PDF export over USB, a configurable alarm, a tripod and a 2000 mAh battery for more than nine hours. The accuracy figure is both the best and the most awkward thing in the listing.
Credit first: it publishes an accuracy figure
Air quality monitors are the category most prone to showing a number with no stated tolerance. We have reviewed units that display seven different measurements and publish not one accuracy figure for any of them.
This listing gives one: plus or minus 12 micrograms per cubic metre for PM2.5 and PM10, with a resolution of 1 microgram and a range of 0 to 1000. It also gives the counting range, 2,000,000 particles per litre, and names the three size channels.
That is a real and uncommon disclosure, and it is the only reason the rest of this review can be written. You cannot assess an instrument that tells you nothing about its own uncertainty.
Now read the figure against what people care about
Here is the difficulty. Published health guidance for fine particulate exposure is expressed in low numbers. Annual average targets for PM2.5 sit in the single figures of micrograms per cubic metre, and short term targets in the low tens.
Against that, a tolerance of plus or minus 12 is not a refinement. It is comparable to, or larger than, the entire level of interest.
Work it through. The display reads 15 micrograms per cubic metre. Within the stated tolerance the true value could be 3, which is very clean air, or 27, which is not. Both conclusions are consistent with the same reading, and they point to opposite actions.
That is not a criticism of this instrument specifically. It is the honest state of affordable optical particle sensing, and a unit that publishes 12 is being straighter with you than one that publishes nothing and is probably no better. But it does mean the instrument answers one kind of question and not another.
The question it answers well is relative. Did the count rise when the sanding started. Does it fall when the extraction runs. How long does the kitchen take to clear after cooking. Is the bedroom worse with the window shut. All of those are comparisons between readings taken minutes apart on the same instrument, where a consistent offset cancels out and a tolerance of 12 does not obstruct the conclusion.
The question it cannot answer is absolute. Whether a room complies with a guideline value needs an instrument whose uncertainty is small relative to the limit. Our page on why particle sensors disagree goes into why two monitors in the same room can differ by more than this tolerance.
Counting and mass are two different numbers
The listing reports both, and the distinction is worth holding onto.
The instrument counts particles optically: a laser illuminates a sampled airstream and the scattered light is sorted into size bins, here 0.3, 2.5 and 10 microns. That is the direct measurement, and it is expressed as a count per litre.
The PM2.5 and PM10 figures in micrograms per cubic metre are mass concentrations, and they are calculated from the counts by assuming something about how dense the particles are and what shape they are. Wood dust, cooking aerosol, candle soot and road grit are not the same density, so the conversion is an approximation that is better for some aerosols than others.
The practical implication is that if you want the most defensible comparison from this instrument, use the particle counts rather than the mass figures, because the counts are what it actually measured.
The fixed position design is the right choice
| Specification | Published in the listing |
|---|---|
| Channels | 0.3, 2.5 and 10 microns |
| Counting range | Up to 2,000,000 particles per litre |
| Mass range | PM2.5 and PM10, 0 to 1000 micrograms per cubic metre |
| Mass accuracy | Plus or minus 12 micrograms per cubic metre |
| Mass resolution | 1 microgram per cubic metre |
| Temperature | Minus 10 to 60 C |
| Storage | 999 records, customisable interval, on screen trend curves |
| Export | PDF to PC over USB |
| Alarm | Customisable threshold, audible, colour bar |
| Battery | 2000 mAh, more than nine hours, auto sleep and shutdown |
| Included | Tripod, USB cable, adapter, case |
| Flow rate | Not stated in the listing bullets |
| Counting accuracy or efficiency | Not stated in the listing bullets |
| Calibration | Not stated in the listing bullets |
Including a tripod tells you how the manufacturer expects it to be used, and they are right. Particle concentration varies sharply with position and air movement, so a counter carried around the room records your own walking as much as the air. Mounted at a fixed height away from walls and left alone, the 999 record log with adjustable intervals becomes a genuine picture of a space.
The missing flow rate is the gap that matters most for the counting figures. A particle counter samples a known volume per unit time, and the reproducibility of a count depends on that flow being stable and known. Instruments intended for cleanroom work publish it. This one does not, which caps how far the count figures can be pushed.
Who should buy it
Buy this to find out whether something you do changes the air: woodworking extraction, a 3D printer in a spare room, cooking, a renovation next door, a new filter. On a tripod with a logging interval set and a trend curve to look at afterwards, it answers those questions well, and the PDF export gives you something to keep.
Do not buy it to establish compliance with a guideline, because a tolerance of plus or minus 12 micrograms per cubic metre is as large as the levels those guidelines concern themselves with. The listing deserves credit for telling you that, and the right response to being told is to use the instrument for what the figure supports.
Recommended Tools


Products shown because their documented specifications fit this guide. Price and availability are on Amazon and can change.
Frequently Asked Questions
What does plus or minus 12 micrograms per cubic metre mean in practice?
It sets the floor on what the instrument can tell you. Published health guidance for fine particles sits in the single figures to low tens of micrograms per cubic metre for long term exposure, so a tolerance of 12 is comparable to or larger than the whole level of interest. A reading of 15 could be 3 or 27. The instrument is therefore a good tool for watching change and a poor tool for deciding whether a room meets a guideline.
What is the difference between particle counting and mass concentration?
Counting reports how many particles are present per unit volume, in this case for 0.3, 2.5 and 10 micron sizes up to 2,000,000 per litre. Mass concentration reports how much they weigh per cubic metre, which is what PM2.5 figures normally mean. Counting is the more direct measurement here and the mass figure is derived from it with assumptions about particle density and shape. For comparing one moment to another, counting is the better number.
Why does the tripod matter?
Because it signals the instrument is meant to be left in position rather than waved around. Particle readings vary enormously with location and air movement, so a counter held in the hand gives numbers that reflect your own movement as much as the room. Fixed on a tripod at a sensible height, away from a wall, it measures the room.
Is the PDF export useful?
It is a reasonable compromise. The listing states 999 records with customisable logging intervals, on screen trend curves, and export to a PC as PDF over USB. A PDF is a document rather than data, so you cannot replot it or combine it with another dataset, but it is a self contained record that will still open in years to come without the vendor software.
What is not published?
The counting efficiency or accuracy for the particle count channels, which is given only for mass concentration. No flow rate, which is the figure that determines how reproducible a particle count is. No statement about calibration or recalibration. And a 0.3 micron smallest channel, which is standard for this class but well above the very fine particles that penetrate deepest.
Affiliate disclosure: Akermin earns a commission from qualifying Amazon purchases made through links on this page. Our editorial picks are based on documented specifications and owner feedback, not commissions.