As an Amazon Associate, Akermin earns from qualifying purchases. Product links on this page are affiliate links.
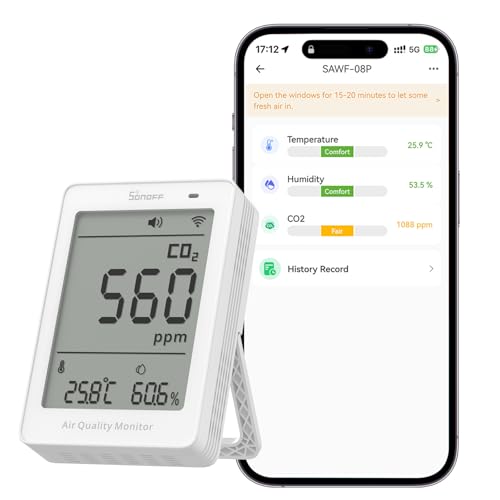
SONOFF · SONOFF AirGuard CO2 SAWF-08P, Smart Indoor Air Quality Monitor, Matter Compatible, 2.4GHz WiFi, CO2 Monitor for CO2/Temp/Humidity, Real-Time Display & Notification, for Bedroom, Nusery Room
View on AmazonPrice and availability are shown on Amazon and can change at any time.
A mains powered indoor monitor that shows carbon dioxide, temperature and humidity together on one screen, built around a genuine NDIR carbon dioxide sensor, updating every 5 seconds, joining Apple Home, Alexa, Google Home, SmartThings or Home Assistant through Matter, and keeping 12 months of history in the eWeLink app with charts and an export. The figure that decides how you may use it is the accuracy, written as plus or minus 50 ppm plus 5 percent of reading, which is a wider band than a single number would suggest and a very different width at each end of the scale.
Why the accuracy is a formula rather than a figure
Most monitors in this class publish a single tolerance, or publish nothing. This one publishes an expression, and that is more honest, because the error on an NDIR sensor genuinely is not constant across its range.
Work it out at the levels people actually read:
| Reading | Stated tolerance | Band |
|---|---|---|
| 400 ppm | 50 plus 20 | Plus or minus 70 ppm |
| 800 ppm | 50 plus 40 | Plus or minus 90 ppm |
| 1000 ppm | 50 plus 50 | Plus or minus 100 ppm |
| 1500 ppm | 50 plus 75 | Plus or minus 125 ppm |
| 2000 ppm | 50 plus 100 | Plus or minus 150 ppm |
| 5000 ppm | 50 plus 250 | Plus or minus 300 ppm |
The two terms exist for different physical reasons. The fixed 50 ppm is the sensor floor: offset, noise and the limits of its optical path, all of which are there whatever the concentration. The 5 percent is gain error, the uncertainty in the slope of the response, which necessarily grows with the reading.
The practical consequence is a rule about what you are allowed to conclude. A reading of 950 and a reading of 1050 are not distinguishable on this instrument, so treating one as acceptable and the other as a problem is reading precision that is not there. A room that goes from 500 to 1200 over an afternoon has moved far outside the band, and that change is real.
This is the single most useful thing to understand about consumer carbon dioxide monitors generally. They are good at trends, at comparing a room against itself, and at verifying that a ventilation change did something. They are poor at defending a threshold. Our explainer on how to read a carbon dioxide accuracy specification takes that further.
NDIR is the word that matters, and it is printed
The second bullet names the sensor type, which deserves credit, because the alternative is the most common deception in this whole category.
NDIR stands for non dispersive infrared. An infrared source shines through a chamber of room air onto a detector filtered to the wavelength carbon dioxide absorbs. More gas in the path means less light arriving, and the loss is the measurement. It is a direct measurement of the molecule you care about.
The alternative that appears on cheaper devices is a label reading eCO2. The e is for estimated. Those units have a sensor for volatile organic compounds and infer a carbon dioxide figure from the assumption that human occupancy raises both together. The inference collapses the moment anything else raises the organic reading, so frying an onion, spraying a cleaner or opening a tin of paint produces a dramatic carbon dioxide spike with no carbon dioxide behind it. If you are buying a monitor to judge ventilation, that device cannot do the job. Our guide on checking for a true NDIR sensor covers how to tell them apart on a listing.
What is missing from this bullet is the calibration behaviour. Nothing here says whether the monitor runs an automatic baseline routine, how long its window is, or whether a manual calibration in fresh air is possible. On a device whose headline feature is a year of history, that omission matters more than it would on a desk gadget, because baseline drift is the error that accumulates over exactly that timescale.
Continuous power is a specification hiding in a sentence about speed
The accuracy bullet ends with a sentence that looks like a boast and is actually a constraint: the continuous power supply ensures data updates every 5 seconds.
That is the listing telling you this is a tethered device, and the trade runs in both directions.
In its favour, energising an infrared source is the expensive part of an NDIR measurement, which is why battery monitors sample at intervals of minutes and still need charging. Permanent power is what makes a 5 second update rate and an unbroken year of records possible at all. The feature set and the power requirement are the same decision.
Against it, three things follow. You cannot carry this around a building comparing rooms, which is how most people first want to use a monitor. Placement is decided by the nearest socket rather than by where a representative reading lives, and sockets are often in the worst places: at desk height where someone is breathing on it, or beside a door where the draught washes it. And no battery backup is mentioned anywhere, so a year of history is a year only if the power never drops.
One more thing to be aware of rather than to hold against it. A permanently powered device has permanently warm electronics inside the same housing as its temperature and humidity sensors, and the listing does not say whether the temperature reading compensates for that. It is worth putting a separate thermometer beside it for a day and noting the difference before you trust the figure.
Three readings on the screen, one accuracy figure in the bullets
The all in one bullet is explicit: carbon dioxide, temperature and humidity, all displayed together on one screen. The accuracy bullet covers one of those three.
| Measurement | Accuracy published |
|---|---|
| Carbon dioxide | Plus or minus 50 ppm plus 5 percent, over 400 to 5000 ppm |
| Temperature | Not stated in the listing bullets |
| Relative humidity | Not stated in the listing bullets |
| Resolution, any channel | Not stated in the listing bullets |
| Measuring range, temperature | Not stated in the listing bullets |
| Measuring range, humidity | Not stated in the listing bullets |
The humidity gap is the one that costs something. People buy a humidity reading to make two decisions: whether condensation is likely, and whether a space is damp enough to grow mould. Both of those live in the upper part of the scale, above about 70 percent, which is precisely where inexpensive capacitive sensors are least linear and most in need of a published tolerance. A figure with no tolerance cannot support either decision.
Dew point arithmetic makes it worse rather than better, because it combines the temperature error and the humidity error into one result. If you need a humidity figure you can defend, this is not the instrument to get it from, and that is a statement about the listing as much as about the hardware.
Taken for what it is, the extra two channels are useful context. A carbon dioxide rise with a temperature rise and a humidity rise is a room filling with people. A carbon dioxide rise on its own is more likely to be a ventilation change. Having all three on one screen genuinely helps you interpret the one measurement that is specified.
Twelve months of history with an export is the part that compounds
Most monitors give you a live number, a graph covering a day or two, and nothing you can take away. This one states full access to 12 months, graphical charts in the app, and an export.
That changes what the device is for. A carbon dioxide number on a screen tells you about now, and now is rarely the question. The questions people actually have are about shapes over time: how high does this bedroom climb between midnight and six, does opening the window on the landing change it, did the new extractor fan in the office do anything, is the meeting room recoverable between bookings. All of those need a record, and a monitor without one cannot answer any of them.
An export matters separately from a chart, because it is what lets you put a measurement in front of someone else. A landlord, a school, an employer or a building manager will discuss a spreadsheet and will not act on a screenshot of an app. Our round up of monitors with exportable data explains why that single feature filters the category so heavily.
What the listing does not say is the retained sampling interval, the export format, or whether the history survives moving the device to another account or hub. The interval is the one to ask about, since it decides whether the archive can show a short event or only a daily shape.
The right room for this, and the wrong one
This is a fixed monitor for a bedroom, nursery, home office or small meeting room that has a socket, where you want a permanent record and a device your existing smart home can act on. Matter support is the part that makes the data do something rather than merely exist: a reading crossing a level can trigger a fan, a notification or a light, which is a different product from a screen you have to remember to look at. The NDIR sensor and the year of exportable history are the two features that justify choosing it over something cheaper.
Look elsewhere in four cases. If you want to walk around a building comparing rooms, buy a battery unit. If you need humidity figures you can defend to a landlord or an insurer, nothing here supports them. If you are monitoring a greenhouse or grow room, where concentrations are deliberately held well above outdoor air, settle the calibration question first, because an unstated automatic baseline could quietly re-zero against your enriched atmosphere. And if the point is to have data through a power cut, this is the wrong architecture entirely.
Recommended Tools


Products shown because their documented specifications fit this guide. Price and availability are on Amazon and can change.
Frequently Asked Questions
What does plus or minus 50 ppm plus 5 percent actually work out to?
You add the two terms at whatever concentration you are reading. At 400 ppm it is 50 plus 20, so 70 ppm. At 1000 ppm it is 50 plus 50, so 100 ppm. At 2000 ppm it is 50 plus 100, so 150 ppm. At the top of the stated scale it is 50 plus 250, so 300 ppm. The fixed term is the sensor floor, its offset and noise. The proportional term is gain error, which grows with the reading. That is why the specification has two parts instead of one.
Is an NDIR sensor really better than the alternative?
For CO2 it is not better, it is the only one that measures the gas. NDIR shines infrared through a sample and measures how much is absorbed at the wavelength CO2 absorbs. A monitor that reports eCO2 instead has a volatile organic compound sensor and estimates carbon dioxide from a correlation, so it responds to cooking, cleaning products and aerosols rather than to the gas you asked about. This listing names NDIR in the second bullet, which is the thing to look for.
Why does the listing mention a continuous power supply in the accuracy bullet?
Because the two are connected. Taking an NDIR reading means energising an infrared source, which is the power hungry part of the device, so battery powered monitors sample at long intervals to survive. A monitor on permanent power can afford to sample every 5 seconds and keep doing it indefinitely. The sentence is really telling you two things at once: the update interval is fast, and the device has to stay plugged in.
Can I trust the temperature and humidity figures?
Treat them as context for the CO2 reading rather than as measurements you would act on. The all in one bullet promises all three on one screen, and the accuracy bullet covers only CO2. No tolerance is published for temperature or humidity, and no resolution for anything. That matters most for humidity, because the decisions people make with it, condensation and mould risk, sit in the damp end of the scale where inexpensive sensors are least linear.
What is automatic baseline calibration and does this monitor use it?
It is a routine that assumes the lowest reading seen over a rolling window is fresh outdoor air, around 400 ppm, and quietly re-zeroes the sensor against it. It keeps a monitor honest in a normal room that empties overnight. It goes wrong in a space that never reaches outdoor levels, such as a greenhouse, a grow room or a bedroom that is occupied and closed for long stretches, because the monitor adopts the elevated background as its zero. The listing does not say whether this monitor runs such a routine or whether it can be calibrated manually, and on a device sold for long term tracking that is the most consequential unstated item on the page.
Does 12 months of history mean 12 months of 5 second readings?
Almost certainly not, and the listing does not say what it does mean. A 5 second update is a display and notification rate. Stored history is normally thinned as it ages, so recent data may be minute by minute while older data is hourly. The distinction decides what you can see: an hourly average will show a working day filling up and will completely hide a 20 minute meeting. Ask what interval is retained before relying on the archive for anything short.
Affiliate disclosure: Akermin earns a commission from qualifying Amazon purchases made through links on this page. Our editorial picks are based on documented specifications and owner feedback, not commissions.
Related Guides

Temtop Handheld Particle Counter Review: Three Channels and No Published Flow Rate
A pump suction handheld particle counter reading 0.3, 0.5 and 1.0 micron channels alongside PM2.5, PM10 and TSP, with temperature and humidity sensors, 32 GB of internal storage and a 3500 mAh battery.
Read More→
VETOUCH Plug In CO2 Monitor Review: An Alarm the Bullets Never Define
A mains powered three in one monitor showing carbon dioxide, temperature and humidity on a 1.83 inch colour screen, with three brightness settings and a display that flips 180 degrees.
Read More→
Sainlogic Air Quality Monitor Review: A Tolerance for Temperature, None for CO2
A portable indoor air quality monitor with a 7.2 inch display, tri colour status LED, seven thresholds you set yourself and nine readings covering CO2, three particulate sizes, formaldehyde, TVOC, temperature and humidity.
Read More→