Skip to content
AkerminMeasure. Monitor. Improve. Compare Products

The Best Barometers for Weather Monitoring: 7 Picks

A barometer is the only common weather instrument that tells you what is coming rather than what is happening. The hard part is choosing between a fixed weather station, a handheld weather meter and a logging sensor, because each answers a different question. This page separates the three.

  • Independent Research
  • Verified Specifications
  • Honest Recommendations

Measure It
Compare It
Buy Once

As an Amazon Associate, Akermin earns from qualifying purchases. Product links on this page are affiliate links.

Our Top Picks

This comparison was assembled from the manufacturer listing text supplied for each product. Only products that genuinely measure barometric pressure for weather monitoring were included; the list was not padded to a round number. Where two products are functionally identical, that is stated rather than dressed up as a difference.

Most precise stated accuracy
Digi-Sense Traceable Calibrated Digital Barometer

Digi-Sense Traceable Calibrated Digital Barometer

A calibrated bench barometer that publishes its pressure accuracy and logs 24 hours of readings.

  • Measures pressure, temperature and relative humidity
  • Pressure range 7.25 to 14.94 PSI, resolution 0.1 inHg, accuracy 0.12 inHg
  • Four line LCD with bar graph pressure trend and time of day
  • Min and max readings stored automatically each hour, recallable for the past 24 hours
View on Amazon Read Full Review→
Best simple local pressure display
NURQEMOL Digital Barometer Weather Forecast Clock

NURQEMOL Digital Barometer Weather Forecast Clock

A four inch desk display that reads actual local pressure and lets you calibrate it by hand.

  • Measures actual barometric pressure at the product's location
  • Manual pressure calibration from the front buttons
  • Four inch display showing time, indoor temperature, humidity, pressure, trend and weather icons
  • Backlight runs for approximately 10 seconds on a short press
View on Amazon Read Full Review→
Best for outdoor activity use
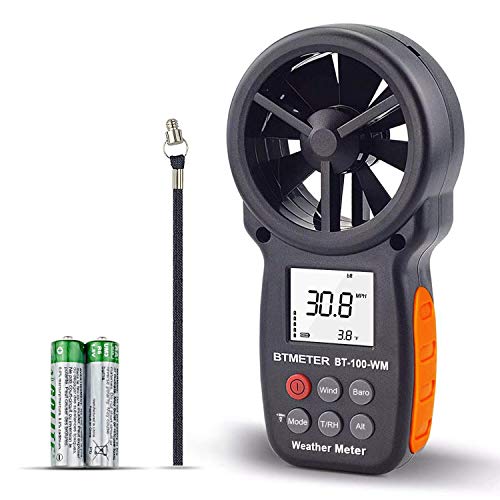
BTMETER BT-100WM Handheld Anemometer

BTMETER BT-100WM Handheld Anemometer

A handheld weather meter that adds pressure and altitude to wind and humidity.

  • Measures wind speed, wind temperature, wind chill, relative humidity, dew point, barometric pressure and altitude
  • Wind speed range 0.67 to 67.1 mph at plus or minus 5 percent accuracy
  • Wind temperature range minus 10 to 45 C, 14 to 113 F, at plus or minus 2 degrees
  • Altitude range 0 to 19685 ft; pressure displayed in inHg or hPa mbar
View on Amazon Read Full Review→
Best fixed weather station
La Crosse Technology 308-1417 Wireless Weather Station

La Crosse Technology 308-1417 Wireless Weather Station

A wireless station with a 24 hour pressure graph, tendency indicators and a 330 ft sensor range.

  • Dynamic forecast display with tendency indicators
  • Barometric pressure historical graph with past 24 hour view
  • Indoor and outdoor temperature in F or C with humidity and min max records
  • Includes weather resistant sensor with 330 ft range, no obstructions
View on Amazon Read Full Review→
Best for logging to a computer
Starpath USB Barometer with Software

Starpath USB Barometer with Software

A USB pressure sensor with software and NMEA output for marine use.

  • High precision pressure sensor
  • Convenient USB connector
  • NMEA output for marine applications
View on Amazon Read Full Review→
Best large numeral desk clock
TecScan FUNcaster Barometer Ambient Weather Clock

TecScan FUNcaster Barometer Ambient Weather Clock

A live barometer clock with oversized numerals for reading across a room.

  • Active barometer with real time weather forecasting
  • Actual live barometric pressure reading
  • Large display measuring 4.5 by 2.25 by 0.75 inches
  • Numerals 80 percent larger than previous models, readable from 5 to 6 feet
View on Amazon Read Full Review→
Best handheld with pressure logging
HoldPeak 866B-WM Handheld Weather Meter

HoldPeak 866B-WM Handheld Weather Meter

A six in one handheld that records 16 sets of pressure data and supports altitude correction.

  • Measures wind speed, temperature, humidity, dew point, altitude, barometric pressure and wind chill
  • Records 16 sets of barometric pressure data
  • Manual barometric pressure correction before measuring altitude
  • Unit switching for wind speed, temperature, altitude and pressure
View on Amazon Read Full Review→

Comparison Table

View Full Comparison→
PickTypePressure accuracyTrend displayLoggingAltitude correction
Bench barometer0.12 inHg statedBar graph24 hour min max, hourlyNot statedView
Desk displayNot statedTrend indicatorNoneManual calibrationView
Handheld weather meterNot statedNot statedData log mentionedAltitude computed, no correction statedView
Wireless weather stationNot stated24 hour graph and tendencyMin max recordsNot statedView
USB sensorNot statedNone, software dependentVia host computerNot statedView
Desk clockNot statedForecast indicationNoneNot statedView
Handheld weather meterNot statedNot stated16 pressure setsManual correction statedView

Cells are drawn only from the supplied listing text. Where a listing does not publish a figure the cell reads Not stated. P3 and P7 are functionally similar handheld meters; P7 is listed here because it publishes the pressure logging and altitude correction detail.

How to choose a barometer for weather monitoring

The decision comes down to where the instrument sits and what you want to do with the number.

Decide fixed or handheld first

A fixed station reads one place continuously and shows trend; a handheld reads many places once. Forecasting needs the fixed one.

Insist on a trend display

A single pressure number cannot forecast. A graph, arrow or tendency indicator is what turns a reading into a prediction.

Check whether altitude correction is offered

If you compare your reading with an airport or weather app, you need sea level correction or manual calibration, or the numbers will never agree.

Look for a published accuracy figure

Only P1 publishes one here. Without it you cannot tell a real 0.05 inHg change from instrument drift.

Match logging to the job

If you want a record, choose USB logging or a station with stored history. A 16 point handheld log is a snapshot, not a record.

Remember what it does not do

A barometer forecasts nothing about temperature, and a handheld weather meter does not alarm. If you need a warning, you need an alarm function.

Frequently Asked Questions

View All FAQs→
Why does my barometer not match the pressure in the weather app?

Because the app is showing sea level corrected pressure and your barometer is showing the pressure where it sits. Air pressure falls with altitude, so a station a few hundred feet above sea level reads lower. The correction exists so that stations at different heights can be compared. If you want to match the app, apply the calibration or altitude correction your instrument offers.

Why can a barometer forecast when a thermometer cannot?

Because pressure is a measure of the whole air mass above and around you, and that mass moves. A falling glass means a low pressure system is approaching, which usually brings cloud, wind and rain. A thermometer measures the local temperature of the air at one point, which tells you nothing about what is arriving. Pressure has memory of the last few hours; temperature largely does not.

What pressure change is worth paying attention to?

The listing for P1 gives 0.12 inHg accuracy and 0.1 inHg resolution, which sets the scale. A change of a few hundredths of an inch over three hours is a real trend; a change of that size over three minutes is usually noise or a door opening. Watch the shape of the graph rather than any single number.

Do I need altitude correction?

Only if you want your readings to be comparable with another location or with a published sea level pressure. If you are tracking trend at one fixed spot, the absolute offset does not matter because it is constant. If you move the instrument, or compare with an airport, you need the correction. P7 states manual correction for altitude; P2 states manual calibration.

Reviews

Digi-Sense Traceable Calibrated Digital Barometer

Digi-Sense Traceable Calibrated Digital Barometer Most precise stated accuracy

This is the only product in the set that publishes a pressure accuracy figure. The listing states 0.12 inHg accuracy across a 7.25 to 14.94 PSI range at 0.1 inHg resolution. That matters because a barometer used for weather monitoring is looking for changes of a few hundredths of an inch of mercury over three hours; if the absolute accuracy is unknown, you cannot tell whether a 0.05 inHg move is weather or instrument drift. The published figure lets you set a threshold you trust.

The trend display is a bar graph rather than a single number, which is the correct way to read pressure for forecasting. The listing also says min and max readings are stored internally each hour and can be recalled for the past 24 hours, so you can reconstruct the last day of movement without standing next to it. High and low audible and visual alarms are available for pressure, temperature and humidity, which turns the instrument into a monitor rather than a display.

The listing calls it a digital thermometer barometer and describes ambient use in plants and labs. It is a bench instrument, not a pocket one. The alarms are the useful part for a plant room or a lab where nobody watches a screen all day.

Strengths

  • Publishes a pressure accuracy figure, 0.12 inHg, which most barometers here do not
  • 24 hour min and max storage with hourly capture
  • Audible and visual high and low alarms on pressure, temperature and humidity
  • Trend shown as a bar graph, which is the readable form for forecasting

Limitations

  • No altitude or sea level correction is mentioned in the listing
  • No wind or outdoor sensor, so it is an indoor ambient instrument only
  • The listing does not state a sampling interval for the trend graph
  • Bench format, not portable
View on Amazon
NURQEMOL Digital Barometer Weather Forecast Clock

NURQEMOL Digital Barometer Weather Forecast Clock Best simple local pressure display

The listing makes an unusually honest point: this measures the actual pressure where it sits, and readings may differ from weather apps or airport reports that use sea level corrected pressure. That is the single most common confusion in home barometry. An airport report is corrected to sea level so that stations at different altitudes can be compared; a desk barometer reads what the air actually weighs at your elevation. If you live a few hundred feet above the airport, the numbers will never match, and that is not a fault.

The front button calibration is the mechanism that resolves it. You can set the displayed value to match a known reference, which effectively applies an altitude offset. The listing does not state a pressure accuracy figure, so the calibration is what you rely on rather than a published tolerance. The four inch screen shows time, indoor temperature, humidity, local pressure, trend and weather icons together, and the trend arrow is the forecasting element.

The backlight is a short press for about ten seconds. There is no outdoor sensor and no logging. This is a display for a desk or hallway where you want to glance at pressure and trend, not an instrument for recording a storm.

Strengths

  • Explains plainly that it reads local pressure, not sea level corrected pressure
  • Manual calibration accessible from the front buttons
  • Trend and weather icons on the same screen as the pressure value
  • Simple to read from across a room

Limitations

  • No pressure accuracy figure published in the listing
  • No data logging or history beyond the trend indication
  • Indoor sensing only, no outdoor sensor
  • Backlight is a ten second burst, not continuous
View on Amazon
BTMETER BT-100WM Handheld Anemometer

BTMETER BT-100WM Handheld Anemometer Best for outdoor activity use

This is a vane anemometer first and a barometer second. The listing gives a wind speed range of 0.67 to 67.1 mph at plus or minus 5 percent, wind temperature at plus or minus 2 degrees, and altitude from 0 to 19685 ft. Pressure is one of seven measured quantities, displayed in inHg or hPa mbar. No pressure accuracy or resolution figure is published, so treat the pressure channel as an indicator rather than a reference.

The altitude function is the reason pressure appears at all. A handheld meter that computes altitude from barometric pressure needs a pressure reading, and the listing offers data log and a tripod hole for mounting. That combination suits long range shooting, hunting, sailing and kite flying, where you want a snapshot of conditions at a spot rather than a continuous record at a fixed point.

The limitation is the same as every handheld: it reads pressure where you are standing, at your altitude, and it does not correct to sea level unless you do the arithmetic. For comparing conditions between two hillsides that is fine. For tracking a front moving through, a fixed station is better.

Strengths

  • Pressure, altitude, humidity and dew point in one handheld
  • Wind speed accuracy and range are published
  • Tripod mount and data log for stationary use
  • Five wind speed units and two pressure units

Limitations

  • No pressure accuracy or resolution figure published
  • No sea level correction mentioned
  • Pressure is a secondary channel behind wind speed
  • No continuous logging to a computer
View on Amazon
La Crosse Technology 308-1417 Wireless Weather Station

La Crosse Technology 308-1417 Wireless Weather Station Best fixed weather station

The pressure graph is the feature that makes this a weather station rather than a clock. The listing states a barometric pressure historical graph with a past 24 hour view, plus tendency indicators on the forecast display. A 24 hour graph is what lets you see the shape of a change: a steady fall over six hours means something different from a sharp dip and recovery, and a single number cannot show you either. The tendency indicator compresses that into an arrow.

The wireless sensor covers temperature and humidity at up to 330 ft with no obstructions, with min max records and customizable alerts. Pressure itself is measured in the indoor unit, which is normal for this class of station; the outdoor sensor does not report pressure. The listing does not publish a pressure accuracy figure or a resolution, so the graph is best read for shape rather than absolute value.

WWVB time is in the title, which means the clock sets itself from the radio time signal where reception allows. For a kitchen or hallway station that is a convenience, not a measurement feature. The forecast is derived from pressure trend, which is why this instrument forecasts and a thermometer does not.

Strengths

  • 24 hour pressure graph with tendency indicators
  • Wireless outdoor temperature and humidity at 330 ft
  • Customizable alerts and min max records
  • Self setting clock via WWVB in the title

Limitations

  • No pressure accuracy or resolution figure published
  • Outdoor sensor does not report pressure
  • Forecast is a trend derived indication, not a numerical prediction
  • Requires a clear path for the 330 ft wireless link
View on Amazon
Starpath USB Barometer with Software

Starpath USB Barometer with Software Best for logging to a computer

This is the only product here that is a sensor rather than a display. The listing is three lines long: high precision pressure sensor, USB connector, NMEA output for marine applications. It does not publish a pressure range, resolution or accuracy figure, and it does not mention a display, trend graph or forecast. What it does is put pressure onto a computer, where the software can plot it.

That is the right architecture if you want to record pressure over weeks and analyse it. A USB sensor connected to a laptop or a small computer can log continuously, and NMEA output means the pressure sentence can be fed into marine navigation software that expects the standard format. For a sailor watching a glass fall before a front, that is more useful than a wall display because the data is already in the system.

The trade off is that nothing works without the host. There is no screen, no alarm and no standalone forecast. If you want to glance at pressure without booting a computer, this is the wrong product. If you want a record, it is the only one here built for it.

Strengths

  • USB connection for direct logging to a computer
  • NMEA output for marine navigation software
  • Sensor only, so no display to fail or misread
  • Suits long term recording rather than spot checks

Limitations

  • No pressure range, resolution or accuracy published
  • No display, alarm or standalone forecast
  • Requires a host computer and the supplied software
  • Not portable in any practical sense
View on Amazon
TecScan FUNcaster Barometer Ambient Weather Clock

TecScan FUNcaster Barometer Ambient Weather Clock Best large numeral desk clock

The listing is explicit about what this is: an active barometer with a live reading, presented as a weather clock. It gives real time barometric pressure and a forecast derived from it, aimed at golf, boating and outdoor activities. The display is 4.5 by 2.25 by 0.75 inches with numerals 80 percent larger than previous models, readable from 5 to 6 feet.

That readability is the whole proposition. A barometer you cannot read from the doorway does not get used, and the trend is only useful if you look at it often enough to notice a change. The listing does not publish a pressure accuracy, resolution or range, and it does not mention a graph or a stored history. The forecast is described as real time, which means it reflects current trend rather than a forecast model.

Treat this as a legible pressure display with a forecast icon. It is not a logging instrument and it will not tell you how fast pressure fell overnight. For a hallway or a clubhouse where the question is simply whether the glass is rising or falling, that is enough.

Strengths

  • Numerals readable from 5 to 6 feet
  • Live pressure reading with a forecast indication
  • Compact desk format
  • Simple, single purpose display

Limitations

  • No pressure accuracy, resolution or range published
  • No graph or stored history mentioned
  • No outdoor sensor
  • Forecast is a trend indication only
View on Amazon
HoldPeak 866B-WM Handheld Weather Meter

HoldPeak 866B-WM Handheld Weather Meter Best handheld with pressure logging

The listing describes a six in one meter, though it names seven quantities, and the pressure features are the interesting part. It records 16 sets of barometric pressure data, and because altitude is calculated from pressure, you can manually correct the barometric pressure before measuring altitude to get more accurate data. That correction step is the mechanism that separates a usable altimeter from a misleading one.

Here is why it matters. A barometer measures pressure, not height. To convert pressure to altitude the instrument needs a reference, usually the sea level pressure for the day. If that reference is wrong, every altitude reading is offset. The listing's manual correction lets you enter the local reference so the altitude figure is anchored. The same correction, applied in reverse, is what a fixed station does when it displays sea level pressure.

Pressure is displayed in inHg or hPa, alongside wind speed in five units and temperature in C or F. The listing does not publish a pressure accuracy figure, so the 16 point log is best used for relative change rather than absolute records. Max, min and average wind speed, battery level, auto off and backlight round out the handheld package.

Strengths

  • 16 set barometric pressure log
  • Manual pressure correction for altitude measurement
  • Seven measured quantities in one handheld
  • Multiple units for wind, temperature, altitude and pressure

Limitations

  • No pressure accuracy figure published
  • Log is 16 points, not continuous
  • Pressure is one channel among many, not the primary function
  • No sea level correction for weather comparison
View on Amazon

Buying Guide

Short answer: For a fixed indoor station that shows pressure trend and a 24 hour graph, P4 is the most complete weather station here, and P2 is the simpler local pressure display with manual calibration. If you need pressure as one channel among wind, humidity and altitude, the handheld weather meters P7, P3, P8 and P10 cover it, with P7 and P10 adding barometric logging and altitude correction. P1 is the only pick that publishes a pressure accuracy figure, 0.12 inHg, and it is the one to choose if you want a calibrated bench instrument rather than a forecast display. P5 is a USB sensor for logging to a computer and does not forecast. P6 and P11 are forecast and altitude gadgets respectively; P6 is a barometer clock, P11 is primarily an altimeter.

What a barometer actually measures, and why trend beats value

Pressure is the weight of the column of air above the sensor. At sea level that is roughly 14.7 pounds per square inch, which is why P1 is specified across a 7.25 to 14.94 PSI range. Weather does not change that number very much. A deep storm might take it down by half a pound per square inch. The signal you are looking for is small, which is why the accuracy figure matters so much.

The value on its own tells you very little. What tells you something is the rate and direction of change. A glass falling steadily for six hours means a low pressure system is moving in. A glass rising means the opposite. That is why every serious weather barometer shows a graph, an arrow or a tendency indicator. P4 gives a 24 hour historical graph with tendency indicators. P1 gives a bar graph trend. P2 and P6 give a trend or forecast indication. A bare number with no trend is a curiosity, not a forecasting tool.

This is also the answer to why a barometer forecasts and a thermometer does not. A thermometer reads the air at one point right now. A barometer reads the weight of everything above and around you, and that weight changes as air masses move across the map. The instrument is not predicting the future; it is reporting a quantity that changes before the weather does.

Altitude correction and sea level pressure, explained without the confusion

Air pressure falls as you go up. A barometer in a town 500 feet above sea level reads lower than one on the coast, even on the same day with the same weather. That is a problem if you want to compare readings between places, so meteorologists correct every reading to what it would be at sea level. When your weather app shows 1013 hPa, that is a sea level corrected number.

Your barometer, unless it corrects, shows the actual pressure at your elevation. P2’s listing says this directly: readings may differ from weather apps or airport reports that use sea level corrected pressure, and the value can be manually calibrated using the front buttons. That calibration is the correction. P7 states the same idea from the other direction, noting that because altitude is calculated from barometric pressure, you can manually correct the barometric pressure before measuring altitude.

The practical rule is simple. If you are tracking trend at one fixed location, the offset is constant and you can ignore it. If you move the instrument, or compare with a published figure, apply the correction. If you skip it, your altitude readings will be wrong and your pressure will never match the app. For more on how these instruments fit into a wider monitoring setup, see how to choose a barometer for environmental monitoring and environmental monitoring devices.

The specification that separates a usable barometer from a toy

It is the published accuracy, and almost nobody publishes it. Of the seven picks here, only P1 states a pressure accuracy figure, 0.12 inHg, alongside a 0.1 inHg resolution. That is unusual and it is the reason P1 takes the top position for anyone who needs to trust the number rather than just watch it move.

Here is why it matters. If the instrument is accurate to 0.12 inHg and you see a 0.05 inHg change, you cannot be certain the change is real. If it is accurate to 0.02 inHg, you can. Resolution is a different thing entirely: a display that shows 0.01 inHg steps is not accurate to 0.01 inHg, it just has a finer readout. A consumer humidity sensor claiming 0.5 percent accuracy is usually quoting display resolution rather than measurement accuracy, and the same trap exists with pressure. When a listing gives a resolution but no accuracy, treat the resolution as a display feature, not a performance claim.

For trend watching, accuracy matters less than stability. A barometer that is consistently 0.1 inHg high will still show you a fall correctly. A barometer that drifts by 0.1 inHg over a day will invent weather that is not there. This is why the fixed stations and the calibrated bench instrument are the right tools for forecasting, and the handheld meters are the right tools for spot checks.

Fixed station, handheld meter or USB sensor: where each one stops being right

A fixed weather station is the correct instrument for forecasting. It sits in one place, samples continuously and builds a graph. P4 is the fullest example here, with a 24 hour pressure graph, tendency indicators, a wireless outdoor sensor at 330 ft and customizable alerts. P2 and P6 are simpler fixed displays for a desk or hallway, with trend and forecast icons but no logging. If your question is whether the weather is about to change, this is the category you want.

A handheld weather meter is the correct instrument for a spot check at a location. P3, P7, P8 and P10 all measure pressure alongside wind, humidity and altitude. P7 and P10 add pressure logging and altitude correction. These are built for shooting, sailing, hiking and drone work, where you want conditions at a point rather than a record at a place. They stop being right the moment you want to know what happened overnight, because a 16 point log is not a continuous record.

A USB sensor is the correct instrument for recording. P5 is a pressure sensor with a USB connector and NMEA output for marine software. It has no display and no forecast, and it is useless without a host computer. If you want weeks of pressure data to analyse, it is the only pick here designed for that. If you want to glance at the glass before breakfast, it is the wrong choice. For related measurement categories, see anemometers and digital hygrometers.

Maintenance and the mistakes that make readings wrong

The most common mistake is placing the instrument badly. A barometer near a window in direct sun, above a radiator or beside an air conditioning vent will read the local temperature effect before it reads the weather. Pressure changes with temperature in a sealed or semi sealed space, and a sudden draft will move the reading. Put it on an interior wall at a steady temperature and leave it there.

The second mistake is comparing uncorrected local pressure with a sea level corrected forecast and concluding the instrument is broken. It is not. Apply the calibration or correction the instrument offers, as P2 and P7 both describe, and the numbers will line up.

The third is ignoring what the instrument does not do. A barometer forecasts pressure trend, not temperature, not rainfall and not wind. A handheld weather meter measures but does not alarm; if you need a warning when pressure falls below a threshold, you need an alarm function, which P1 provides for pressure, temperature and humidity. And no barometer here is a safety device. It will not warn you about a gas leak, a fire or a storm surge. For those you need dedicated detectors, such as the instruments covered in carbon monoxide detectors and four gas detectors. A barometer tells you the weather is changing. It does not tell you what to do about it.

How We Research

This comparison was assembled from the manufacturer listing text supplied for each product. Only products that genuinely measure barometric pressure for weather monitoring were included; the list was not padded to a round number. Where two products are functionally identical, that is stated rather than dressed up as a difference. Every figure in the table and the reviews is drawn from the listing bullets, and where a listing does not publish a figure the cell or sentence says so. No laboratory testing was performed and no measurements of our own are published.

Read our full review methodology→