As an Amazon Associate, Akermin earns from qualifying purchases. Product links on this page are affiliate links.
They cannot be compared because they are sums over different wavebands. A 400 to 700 nm PAR figure counts only photons between 400 and 700 nanometres. An extended band figure adds photons beyond 700 nm, and sometimes below 400 nm, so the total is larger for the same light source even when both instruments are accurate. To compare two readings you need the same waveband, the same weighting convention, and the same units. If a listing does not state the waveband, treat the figure as uncomparable. None of the air quality monitors named here, including the Dienmern 8-in-1 air quality monitor or the Dienmern 5-in-1 CO2 monitor, measure PAR at all; they measure CO2, temperature and humidity, and are mentioned only to make the point that a meter’s stated waveband or measurand defines what its number means.
What a PAR figure is a sum of
Photosynthetically active radiation is not a single wavelength. It is a waveband, and a PAR meter reports the number of photons in that band arriving per square metre per second, in micromoles per square metre per second, written micromol m-2 s-1. The number is an integral: the instrument counts photons at each wavelength and adds them up across the band.
That means the band edges are part of the definition, not a detail. Change the lower edge from 400 to 380 nm and you admit more photons. Change the upper edge from 700 to 750 nm and you admit more still. Two instruments can both be accurate and still disagree, because they are integrating over different intervals.
The conventional definition used in horticulture and in most plant science is 400 to 700 nm. It is a convention, not a law of physics. It was chosen because those wavelengths drive photosynthesis in most familiar ways, and because it gives everybody a common scale. An extended band figure deliberately widens that interval, usually upward past 700 nm and sometimes downward below 400 nm.
Why the extended band total is larger by construction
If a light source emits any energy outside 400 to 700 nm, and most do, then an instrument integrating over a wider band will report a larger micromole total than one integrating over the narrower band, for the same light at the same place. This is arithmetic, not a sensor fault.
Consider a source that emits strongly in the far red, around 730 to 750 nm. A 400 to 700 nm meter does not see that energy at all. An extended band meter that reaches to 750 nm does. The extended reading will be higher. If you then place the two numbers side by side and conclude that the extended meter reads high or the narrow meter reads low, you have compared two different quantities.
The size of the gap depends on the spectrum. A narrow band LED with little output beyond 700 nm will show a small difference. A broad spectrum source with substantial far red output will show a large one. Because the gap is spectrum dependent, there is no fixed conversion factor. You cannot multiply a 400 to 700 nm reading by a constant to get an extended band reading, and any table that claims to do so is wrong for at least some sources.
The three things that must match before two numbers can be compared
Before two PAR figures can be placed on the same scale, three things must agree.
- Waveband. Both must integrate over the same lower and upper wavelength limits. 400 to 700 nm against 400 to 750 nm is not a comparison.
- Weighting. Some instruments report unweighted photon flux, counting every photon in the band equally. Others apply a plant response weighting, so a photon at 660 nm counts more than one at 450 nm. The two conventions give different numbers for the same light.
- Units and geometry. Micromoles per square metre per second is an area density. A reading taken with a different diffuser, at a different distance, or with a different cosine correction is not comparable even within the same waveband.
Only when all three match is a difference between two readings a difference in the light. Otherwise it is a difference in the instruments.
A worked comparison table
The table below shows how the same hypothetical spectrum produces different totals depending on the band. The numbers are illustrative arithmetic, not measurements of any product.
| Band | What is counted | Effect on the total |
|---|---|---|
| 400 to 700 nm | Photons between 400 and 700 nm | Baseline conventional PAR |
| 400 to 750 nm | Baseline plus photons from 700 to 750 nm | Higher, by the amount of far red present |
| 380 to 750 nm | Baseline plus near UV and far red | Higher again, by the amount of near UV present |
The direction of the change is certain. The magnitude is not, because it depends on the spectrum of the source and the exact edges chosen. This is why an extended band figure and a 400 to 700 nm figure cannot be ranked against each other.
What to do when a listing gives an extended band figure
First, find the stated waveband. If the listing does not publish it, write it down as not stated and do not compare the number with anything. A figure without a band is not a PAR figure in any useful sense.
Second, if you need to compare with published 400 to 700 nm data, use an instrument that reports 400 to 700 nm. Do not attempt to convert. The conversion is spectrum dependent and cannot be done from the micromole number alone.
Third, if you are choosing between instruments for a task, match the instrument to the convention your task uses. A grower following a 400 to 700 nm reference should use a 400 to 700 nm meter. A researcher studying far red effects may legitimately want an extended band instrument, but should report the band alongside every figure.
This is the same discipline that applies to any measurement. A CO2 monitor such as the Aolidsive 3 in 1 wall mount air quality monitor reports CO2 in parts per million with a stated NDIR sensor; the number means nothing without the measurand and the unit. A PAR number means nothing without the band. For a wider treatment of PAR instruments, see the PAR meter buying guide.
Where the confusion comes from in practice
Two things drive it. The first is marketing. An extended band figure is often larger, and a larger number can look better on a specification sheet. A buyer who does not know that the band changed may read the larger number as more light or a better sensor. It is neither; it is a different sum.
The second is that many low cost meters do not publish their band at all. They report a micromole figure and leave the reader to assume 400 to 700 nm. When a second meter with a stated extended band is placed beside it, the two numbers diverge and the user concludes one is wrong. Usually both are right within their own definitions.
The fix is procedural, not technical. Record the band with every reading. If a meter does not state its band, treat its output as an index rather than a calibrated PAR figure, useful for relative changes in one place but not for comparison with published data or with other instruments.
The rule to carry away
A PAR figure is a sum over a stated waveband. If the waveband is not stated, the figure is not comparable. If two figures use different wavebands, they cannot be ranked, converted, or averaged together. Choose the band that matches your reference data, record it with every reading, and treat any extended band number as a separate quantity rather than a better one.
Frequently Asked Questions
Can I convert an extended band PAR reading to a 400 to 700 nm reading?
No, not reliably. The difference between the two bands depends on how much energy the source emits outside 400 to 700 nm, which varies with the spectrum. There is no single conversion factor. You would need the full spectral power distribution to do the arithmetic, and most meters do not provide it.
Which band should I use for growing plants?
The conventional 400 to 700 nm band is the one used in most horticultural references and published data. If you are following those references, use a meter that reports 400 to 700 nm. Extended band instruments are useful for specific research questions about far red or near UV, but their figures should always be reported with the band attached.
Does a higher micromole reading mean more light for the plant?
Not necessarily. A higher reading may simply mean a wider band was counted. Photons outside 400 to 700 nm are not all equally useful to photosynthesis, and some far red effects are regulatory rather than direct energy. Compare readings only within the same band and weighting convention.
The listing for my meter does not state a waveband. What then?
Treat the output as an uncalibrated index. It can still show relative change in one location, for example whether light rises or falls after a change, but it cannot be compared with published PAR data or with another instrument. Write not stated in your records and do not place the number on a 400 to 700 nm scale.
Do the air quality monitors named on this page measure PAR?
No. They measure CO2, temperature, humidity and in some cases other air quality indicators. They are mentioned here only to illustrate that a reading is defined by its measurand and unit. For light measurement you need a PAR meter, not an air quality monitor.
Is an extended band meter more accurate?
Not inherently. Accuracy is a separate property from band width. An extended band meter may be accurate within its band and still produce a figure that cannot be compared with a 400 to 700 nm reading. Band and accuracy are independent specifications, and both must be stated before a number means anything.
Related Guides
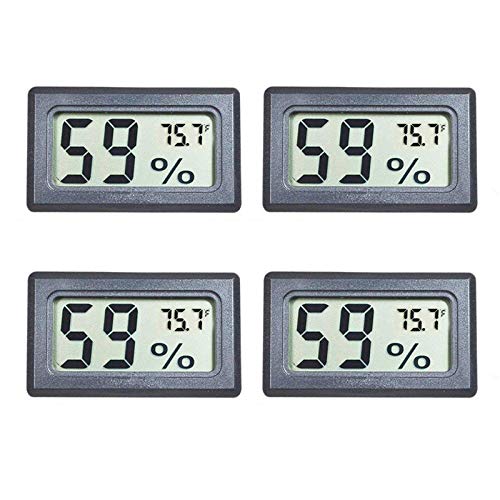
Veanic 4-Pack Mini Indoor Temperature Humidity Meter Review
A close look at the Veanic 4-pack mini humidity and temperature gauge, what its stated accuracy can and cannot support, and where it stops being the right instrument.
Read More→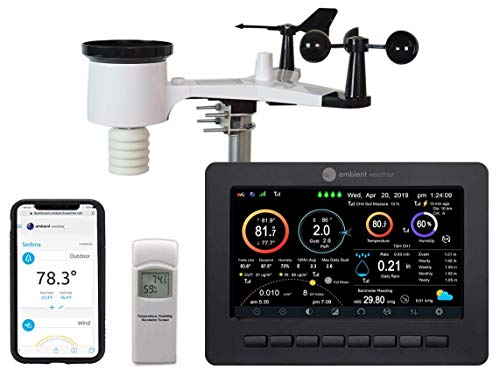
Ambient Weather WS-2000 Review: The First Hour and the First Believable Reading
A first-hour walkthrough of the Ambient Weather WS-2000, covering what the listing states, what it leaves out, and how to reach a first believable reading.
Read More→
EHDIS Manometer Review: A Dual-Port Differential Pressure Meter
A mechanism-first review of the EHDIS dual-port digital manometer, its stated accuracy, and the jobs it does and does not suit.
Read More→