Best PAR Meters: 5 PPFD Picks for Grow Lights and Indoor Plants
A lux meter measures light the way a human eye sees it. A plant does not have eyes. PAR meters count the photons in the band plants photosynthesise with, which is why a bright looking grow space can still be underlit.
As an Amazon Associate, Akermin earns from qualifying purchases. Product links on this page are affiliate links.
Our Top Picks
Meters were compared on the waveband each listing states, the units reported, whether daily light integral is calculated, spectrum breakdown capability, stored point count for mapping and sensor sourcing. We did not run laboratory tests and publish no measurements of our own.
Best Overall
AquaHorti AH-Quantuv PAR Meter
PAR from 400 to 750 nm plus UVA, with the blue, green and red contribution shown separately.
Measures PAR from 400 to 750 nm and UVA from 320 to 400 nm
Displays the PAR contribution of blue, green and red separately
PAR sensor IC from a named Japanese semiconductor manufacturer
Records PAR and UVA for light distribution mapping
PPFD measured across an extended band is not directly comparable with a 400 to 700 nm figure. Check which definition a published photon map uses before comparing it with your own readings.
How to Choose a PAR Meter
The waveband and the units decide whether your readings can be compared with anything else.
Lux Is Not PAR
A lux meter is weighted for human vision, which peaks in green. Plants use blue and red heavily, so a red-rich LED can read low in lux while delivering plenty of usable photons.
DLI Predicts Growth, PPFD Does Not
PPFD is a rate. Daily light integral is the total across a day, and it is the figure that relates to yield. A modest PPFD over a long photoperiod can beat a high one over a short day.
Map the Canopy, Do Not Sample It
Light falls off toward the edges of any fixture. One centre reading overstates what most of your plants receive. A meter that stores points makes a grid practical.
Check the Band Before Comparing
A 320 to 800 nm meter counts photons a 400 to 700 nm meter ignores. Two honest instruments will disagree on the same fixture for that reason alone.
Measure at Canopy Height
Photon density falls with the square of distance. A reading taken at bench level when the canopy is 30 cm higher is not the light your plants get.
Spectrum Matters at Different Stages
Blue is generally favoured for seedling and vegetative growth and red for flowering. A meter that separates them lets you check what a fixture actually delivers.
Because a lux meter is weighted for human vision, which is most sensitive to green light. Plants photosynthesise most effectively with blue and red. A red-heavy LED fixture can therefore read poorly in lux while delivering plenty of usable photons, and a green-rich lamp can read well while delivering fewer.
What is the difference between PPFD and DLI?
PPFD is the rate of photons arriving, measured in micromoles per square metre per second. DLI is the total delivered over a day, in moles per square metre per day. PPFD tells you how bright it is now; DLI tells you how much light the plant actually received.
Why do two PAR meters disagree on the same light?
Usually because they measure different wavebands. A 400 to 700 nm meter ignores far red that a 320 to 800 nm meter counts. Both can be honest and still differ substantially on a modern LED fixture. Check the stated band before concluding one is wrong.
Where should I take the reading?
At canopy height, where the leaves actually are, and at several points across the growing area rather than only under the centre of the fixture. Photon density falls with distance, so a reading taken at bench level when the canopy is higher will overstate what the plants receive.
Does the spectrum breakdown actually matter?
It is useful for understanding what a fixture delivers and for comparing lamps that quote the same PPFD. Blue is generally associated with compact vegetative growth and red with flowering, though plants respond to the whole spectrum and the relationships are not simple rules.
What PPFD should I aim for?
It depends entirely on the species and the growth stage, and published targets vary widely. Use guidance for the specific crop rather than a single number, and remember that the same PPFD over a longer photoperiod delivers a higher DLI.
Reviews
AquaHorti AH-Quantuv PAR Meter Best Overall
Separating the blue, green and red contribution is what lifts this above the rest of the category. A single PPFD number tells you how many photons arrive; it does not tell you what kind. Two lamps delivering identical PPFD can have very different spectra, and the balance matters at different growth stages, with blue generally favoured through seedling and vegetative phases and red through flowering and fruiting.
Extending the band to 750 nm is the other technical choice worth noting. The classic PAR definition stops at 700 nm, but far red between 700 and 750 nm influences plant morphology and is included in newer extended definitions. Measuring it separately from the classic band, and adding UVA on top, gives a fuller picture of what a modern LED fixture is actually producing. The named Japanese sensor IC is more sourcing information than any competitor here provides.
Strengths
Spectrum breakdown by blue, green and red
Extended band to 750 nm plus separate UVA
Sensor manufacturer identified
Records points for mapping light distribution
Limitations
No stated accuracy figure
No DLI calculation stated
Extended band figures are not directly comparable with 400 to 700 nm meters
Lightray Quantum PAR Meter with Photone App Best for DLI
Daily light integral is the number that actually predicts growth, and it is the one most growers never measure. PPFD is an instantaneous rate, photons arriving right now, while DLI is the total delivered across a day. A canopy at a modest PPFD for eighteen hours can receive considerably more light than one at a high PPFD for eight, and only DLI captures that.
Reporting lux alongside PPFD is also genuinely useful, because it lets you calibrate your own intuition. Once you have seen what a given lux figure corresponds to in PPFD under your specific fixture, a cheap lux meter becomes a rough proxy for that fixture. The phone app approach keeps the cost down and makes the arithmetic automatic, at the price of depending on a phone and an app rather than a standalone instrument.
DANOPLUS Quantum PAR Meter Best Published Specification
Publishing the cut-on and cut-off wavelengths with a tolerance is the single most informative thing a PAR meter listing can do, and this is the only one here that does it. A quantum sensor is defined by its spectral response, and a meter whose band is unstated could be anything, including a lux sensor with a green label.
Storing 100 readings makes proper canopy mapping practical. Light from any fixture falls off toward the edges and between plants, and a single centre reading systematically overstates what most of the canopy receives. Walking a grid, recording each point and reviewing them is how you discover that the corners are at half the centre value, which is the kind of finding that changes fixture placement rather than just confirming a number.
Covering 320 to 800 nm means this sees everything from UVA at one end to near infrared at the other, which matches what modern LED fixtures actually emit rather than the classic definition written when lighting meant sodium lamps.
One caution is important and applies to every extended-range meter. A PPFD figure measured across a wider band is not directly comparable with one measured across 400 to 700 nm, because it is counting photons the narrower definition excludes. When comparing against a manufacturer's published PPFD map or against another grower's numbers, check which band both figures use. Used consistently within your own space, the wider measurement is more informative about what your plants are actually receiving.
Strengths
Widest band here, from UVA to near infrared
Separate UVA and infrared readings
Data storage and hold
Low cost for the coverage
Limitations
Extended band figures are not comparable with 400 to 700 nm data
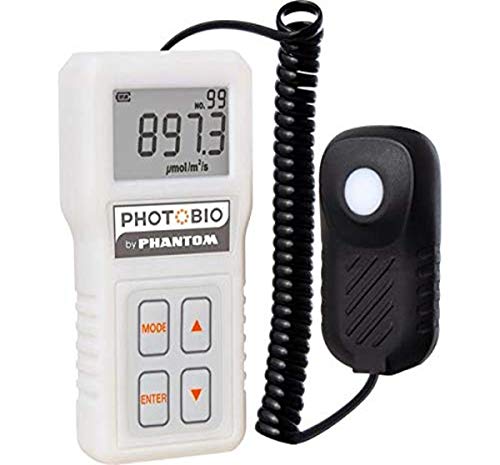
PHOTOBIO Advanced Quantum PAR Meter Best Simple Quantum Meter
The classic definition, measured plainly, from a horticultural lighting brand. There is no spectrum breakdown, no DLI and no extended band, and for a lot of growers that is exactly right: the question is how many photons reach the canopy in the photosynthetic band, and this answers it without configuration.
Being a 400 to 700 nm instrument also means its numbers are directly comparable with manufacturer PPFD maps, published cultivation guidance and other growers' readings, which the extended-range meters are not. If you are working from a fixture's published photon map and want to verify it in your own space, a classic band meter is the one that speaks the same language.
Strengths
Classic 400 to 700 nm band, directly comparable with published data
Short answer: the AquaHorti AH-Quantuv is the most informative meter here because it breaks the reading down by blue, green and red and adds UVA; the Lightray with Photone is the cheapest way to get daily light integral, which is the number that actually relates to growth; and the DANOPLUS Quantum is the one to buy if you want a published waveband and 100 stored points for mapping.
Why a light meter misleads a grower
Lux and foot candles are photometric units, which means they are weighted for the human eye. Our vision peaks strongly in green, falls away in blue, and falls away further in deep red. Photosynthesis does close to the opposite: chlorophyll absorbs most efficiently in blue and red and reflects green, which is why leaves look green in the first place.
The consequence is that a lux meter systematically misjudges grow lights. A fixture rich in deep red can look dim to a lux meter while delivering plenty of photosynthetically useful photons, and a white LED tuned for human comfort can read impressively while delivering fewer. A PAR meter counts photons in the photosynthetic band instead of weighting them by how bright they look, which is the measurement that corresponds to what the plant can use.
PPFD is a rate, DLI is the total
Most growers measure PPFD and stop, which leaves out half the picture. PPFD describes photons arriving per second, so it changes the moment you dim a fixture or move it. Daily light integral multiplies that rate by the photoperiod to give the total delivered across a day.
That distinction has practical consequences. A canopy sitting at a moderate PPFD for eighteen hours can receive substantially more total light than one at a high PPFD for eight, and the second setup costs more to run while delivering less. Anyone choosing between running a fixture harder and running it longer is making a DLI decision, whether or not they know the number.
One reading is not a measurement
Light from any fixture is brightest directly beneath it and falls off toward the edges, and the fall-off is steeper than most people expect because photon density drops with the square of distance. A single reading taken under the centre of the lamp will comfortably exceed what the plants at the edge of the tent receive, sometimes by half.
The fix is a grid. Divide the growing area into squares, take a reading at canopy height in each, and write them down or store them in the meter. What usually emerges is a map that explains why the plants at the back have been disappointing, and it often leads to moving a fixture or adding one rather than turning anything up.
Check the waveband before comparing numbers
The classic PAR definition runs from 400 to 700 nm, and it was written when horticultural lighting meant high pressure sodium and metal halide. Modern LED fixtures emit meaningful far red beyond 700 nm, and extended definitions reaching 750 or 800 nm have followed. A meter using the wider band counts photons the narrower one ignores, so two honest instruments will report different PPFD for the same fixture. That is not a fault in either, and it does mean you should check which definition a manufacturer’s photon map uses before comparing it with your own readings. For visible light measurement see the light meter roundup, and for the other half of controlled growing, greenhouse CO2 monitors.
How We Research
Meters were compared on the waveband each listing states and whether a tolerance is given, the units reported, whether daily light integral is calculated, spectrum breakdown capability, the number of readings that can be stored for mapping, and whether the sensor source is identified. We did not run laboratory tests and publish no measurements of our own.
A focused review of the Kestrel 5400 WBGT Heat Stress Tracker, its waterless wet bulb method, onboard logging, and its place beside other environmental instruments on the site.
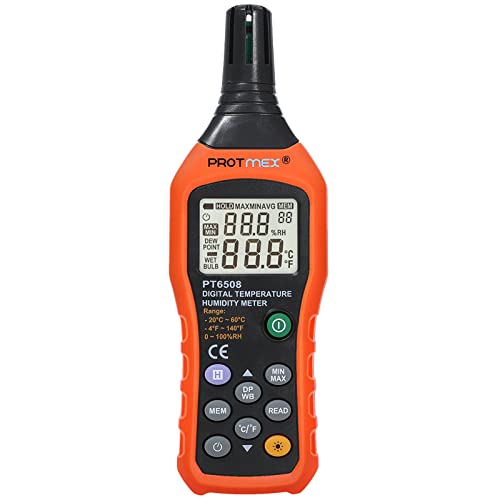
A single-product review of the Protmex PT6508, explaining what its four measurements mean in practice, where the design forces a compromise, and who should buy a different kind of instrument.