As an Amazon Associate, Akermin earns from qualifying purchases. Product links on this page are affiliate links.
Export CO₂ data as a CSV from the monitor’s app or dashboard (Aranet Home: device menu, export; Airthings: dashboard, download; Govee Home: device, data, export; Temtop and SwitchBot: device history, export or via hub), open it in a spreadsheet, confirm the timestamps match a known event, and chart CO₂ against time. Then read four shapes: ramps (people arriving), plateaus (steady occupancy versus ventilation), decays (room emptying, revealing the air-change rate) and spikes (breath near the sensor or doors opening). Those four shapes answer most questions about a room.
Step 1: Export
| Monitor / app | Where the export is | History available |
|---|---|---|
| Aranet4 (Aranet Home) | Device screen, menu, Export (CSV via share) | Up to 90 days stored on device at the set interval |
| Airthings View Plus / Wave (dashboard) | Web dashboard, device, Download data (CSV) | Long-term cloud history |
| GoveeLife H5140 (Govee Home) | Device, data chart, Export | Up to 2 years |
| Temtop (Temtop app) | Device, history, Export | Varies by model |
| SwitchBot Meter Pro CO₂ (SwitchBot app) | Device, history; export needs a Hub for cloud data | With hub, long history |
App layouts change; the manual is authoritative. If a monitor has no export at all, screenshot the chart or choose a different monitor for logging work. See how to choose a CO₂ data logger.
Step 2: Clean the file
- Open in a spreadsheet; check the columns: timestamp, CO₂ (ppm), often temperature, humidity, pressure.
- Check the timestamp against one known event (a meeting start, a window opened). Shift by the time-zone offset if it is off by whole hours.
- Delete the first 15 minutes after any move or power-on; the sensor was settling.
- Convert units if needed; CO₂ should be in ppm.
- Sort by time; some exports are newest-first.
Step 3: Chart it
A line chart of CO₂ versus time for one day at a time, then one week. Add horizontal lines at 800, 1,000 and 1,500 ppm. If occupancy is known, mark arrivals and departures.
Step 4: Read the four shapes
- Ramp: a steady rise after people arrive. Slope proportional to people per room volume. Steeper than expected means the room is smaller or fuller than assumed.
- Plateau: the level where the room settles under steady occupancy. This is the ventilation verdict: under 1,000 ppm adequate, above it under-ventilated for that occupancy. See how to use CO₂ data to evaluate ventilation.
- Decay: the exponential fall after people leave. Fast decay means good air exchange; a flat overnight line means ventilation is off.
- Spike: a sharp needle that recovers in minutes. Breath at the sensor, a door opened from a stuffier room, or a gas hob. Ignore for ventilation analysis.
Step 5: Summaries worth computing
- Percentage of occupied hours above 1,000 ppm (a good single metric for a report).
- Daily maximum and the time it occurred.
- Decay-derived air changes per hour from a clean evening.
- Weekday versus weekend baseline.
Spreadsheet functions handle all of these; no special software is needed. For interpreting individual readings, see how to read CO₂ ppm levels correctly. Monitors with good export are noted in best CO₂ monitors for home and office.
Recommended Tools
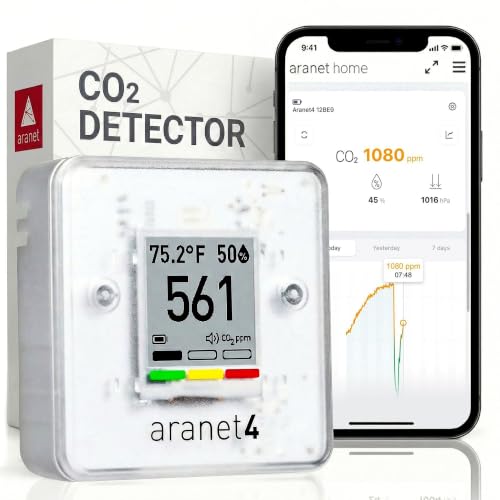


Products shown because their documented specifications fit this guide. Price and availability are on Amazon and can change.
Frequently Asked Questions
Which CO₂ monitors export CSV?
Aranet4 (app, 90 days), Airthings (dashboard, long history), GoveeLife (app, up to 2 years), Temtop (app, varies), SwitchBot (with hub). Check before buying if export matters.
Why are the timestamps in my export wrong?
Many exports use UTC or the phone's time zone at export time. Check one known event (a meeting start) against the chart and shift the column if needed.
What interval should the export have?
Whatever the monitor logged at. For analysis, 1 to 5 minute data is ideal; 10 minute data still shows plateaus and decays clearly.
Affiliate disclosure: Akermin earns a commission from qualifying Amazon purchases made through links on this page. Our editorial picks are based on documented specifications and owner feedback, not commissions.
Related Guides

Temtop Handheld Particle Counter Review: Three Channels and No Published Flow Rate
A pump suction handheld particle counter reading 0.3, 0.5 and 1.0 micron channels alongside PM2.5, PM10 and TSP, with temperature and humidity sensors, 32 GB of internal storage and a 3500 mAh battery.
Read More→
VETOUCH Plug In CO2 Monitor Review: An Alarm the Bullets Never Define
A mains powered three in one monitor showing carbon dioxide, temperature and humidity on a 1.83 inch colour screen, with three brightness settings and a display that flips 180 degrees.
Read More→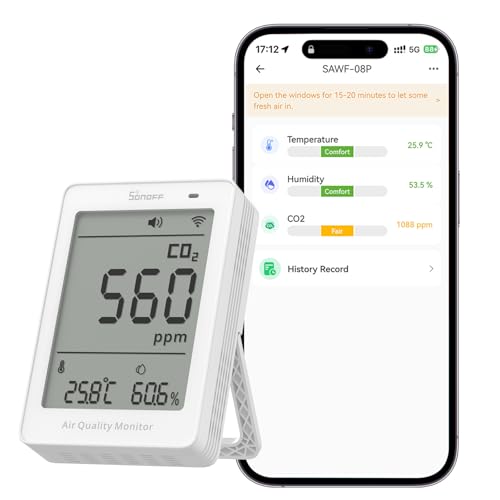
SONOFF AirGuard SAWF-08P Review: NDIR Accuracy Written as a Formula
A mains powered Matter compatible monitor showing CO2, temperature and humidity on one screen, with an NDIR sensor, 5 second updates and 12 months of history in the eWeLink app.
Read More→