Best PM2.5 Monitors: 10 Reliable Picks for Detecting Fine Particle Pollution
PM2.5 monitors come in two families that report different quantities: air quality monitors give a mass concentration in micrograms per cubic metre, and particle counters give counts per size channel. This hub keeps them apart and compares what each listing actually publishes.
Independent Research
Verified Specifications
Honest Recommendations
Mass or Counts
They Are Not the Same
Check the Channels
As an Amazon Associate, Akermin earns from qualifying purchases. Product links on this page are affiliate links.
Our Top Picks
Two kinds of instrument are compared here and they do not report the same quantity. An air quality monitor gives PM2.5 as a mass concentration in micrograms per cubic metre, which is what health guidance is written in. A particle counter gives the number of particles per size channel, which is what cleanroom and filtration work is written in. The Type column marks each one, and the channels column shows how finely each instrument divides the size range.
Best Overall
Temtop P600 PM2.5 Monitor and Particle Counter
A second-generation laser sensor reporting PM2.5 and PM10 as visual health levels.
Second-generation laser particle sensor stated
Reports PM2.5 and PM10 concentrations
Converts readings into colour-coded health levels
Described as both a monitor and a particle counter
Mass concentrations in micrograms per cubic metre and particle counts per channel are different quantities and cannot be converted between reliably, because the conversion depends on particle density and shape. Only one listing here publishes an accuracy figure and none publishes a flow rate or sample volume, which are the specifications that make counts comparable between instruments. Where a listing is silent the cell reads Not stated.
How to Choose a PM2.5 Monitor
The first question is which quantity you need reported:
Mass or Counts
Health guidance is written in micrograms per cubic metre. Filter ratings and cleanroom classes are written in counts per size channel. Buy the instrument that speaks the language of the standard you care about.
How Many Channels
One PM2.5 figure blends fine combustion particles with coarse dust. Several channels show which is driving the reading, and therefore whether filtration, ventilation or a different work method is the answer.
Accuracy at Your Levels
A tolerance of plus or minus 12 micrograms is negligible during a smoke event and larger than the whole reading in clean air. Check the figure against the levels you expect to measure.
Fixed or Portable
A monitor that stays in one room shows you a trend. A handheld counter walked through a building finds the source. Renovation, workshop and facility work needs the second.
It is the mass of airborne particles with a diameter of 2.5 micrometres or less, in micrograms per cubic metre of air. The threshold exists because particles below roughly that size travel deep into the lungs rather than being caught in the upper airway, which is why health guidance is written around it rather than around total dust.
What is the difference between a PM2.5 monitor and a particle counter?
The quantity they report. A monitor estimates mass concentration in micrograms per cubic metre, which is what health guidance uses. A counter reports how many particles were detected in each size channel, which is what filter ratings and cleanroom classifications use. Both usually work by laser scattering, but they express the result differently and the two cannot be converted reliably.
Can I convert particle counts into micrograms?
Not dependably. The conversion depends on the density and shape of the particles, which vary enormously between wood smoke, road dust, pollen and cooking aerosol. Instruments that report both apply an assumed density, which is why two devices in the same room can disagree substantially while both are working correctly.
Why does my reading jump when I cook or vacuum?
Because both generate fine particles directly. Frying, toasting and anything involving hot oil produce large numbers of fine combustion aerosols, and vacuuming disturbs settled dust while some machines pass fine particles straight through. Both readings should fall back within an hour or two with ventilation; a reading that stays elevated points at a continuing source.
Do these instruments need calibrating?
Optical particle sensors drift as their optics accumulate dust and their light source ages, and none of these listings states a calibration interval or method. Keep the inlet clear, avoid running them in heavy dust for extended periods without cleaning, and treat trends over time as more reliable than absolute values unless the instrument came with a calibration certificate.
Reviews
Temtop P600 PM2.5 Monitor and Particle Counter Best Overall
Temtop states a second-generation laser particle sensor that converts PM2.5 and PM10 concentrations directly into visual data with colour-coded health levels. That combination, a laser scattering sensor with a display designed around interpretation rather than raw numbers, is what makes this the most generally useful instrument here.
The colour coding matters more than it sounds. Mass concentration in micrograms per cubic metre is meaningless to most people without a reference, and the reference is not intuitive: the difference between an unremarkable indoor figure and one worth acting on is smaller than most people assume. An instrument that says clearly that the current reading is in a particular band removes a lookup step, which is the difference between a device that changes behaviour and one that produces numbers nobody uses.
The listing gives no measuring range, no accuracy figure, no stated size channels and no battery specification, so the specification detail is thinner than the naming suggests, and calling it a particle counter as well as a monitor stretches the term, since no channel structure is published. For household use, smoke, cooking, dust and wildfire events, the readings and the interpretation are what matter and it delivers both.
Strengths
Laser scattering sensor stated
PM2.5 and PM10 together
Colour-coded health levels remove the lookup step
Suits the common household particle events
Limitations
No measuring range or accuracy stated
Size channels not published
Particle counter claim is not supported by a stated channel structure
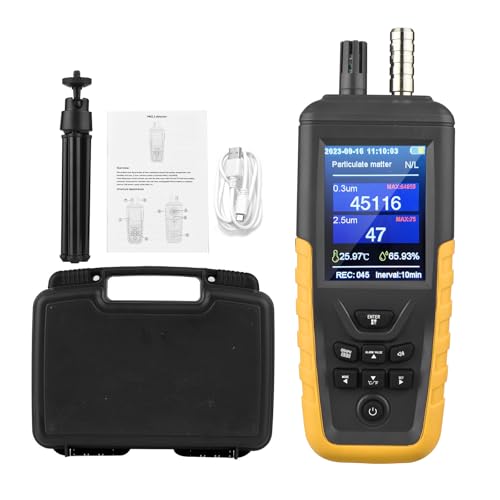
JCKJEDAT JD 3003 Handheld Particle Counter Best for Six Channels
Where a household monitor reports one or two mass figures, a particle counter reports how many particles of each size are present, and that is a different and more diagnostic measurement. The JD 3003 states six channels at 0.3, 0.5, 1.0, 2.5, 5.0 and 10 micrometres, across a stated detection range of 0.3 to 10 micrometres.
Channels reveal sources. Combustion particles, including cigarette smoke, cooking fumes and wildfire smoke, are concentrated at the fine end around 0.3 and 0.5 micrometres. Mechanical particles, sanding dust, soil, fibres and pollen, dominate the coarse channels. A single PM2.5 figure blends both into one number; six channels show which one is driving it, which is what tells you whether the answer is a filter, a different work method or a closed window.
It is also the measurement filtration work is specified in. Filter ratings and cleanroom classifications are written in counts per size, not in micrograms, so a counter is the instrument that can verify them. The listing states no accuracy figure, no flow rate and no sample volume, which are the specifications that make counts comparable between instruments, so treat the numbers as internally consistent rather than absolutely traceable. Three further six-channel counters appear in the table with almost identical stated channel sets.
Strengths
Six size channels published
Distinguishes combustion particles from mechanical dust
Matches how filtration is specified
Handheld for walking a site
Limitations
No accuracy figure stated
Flow rate and sample volume not stated
Counts are not directly comparable with other instruments
WapoRich 3-Channel Air Quality Monitor and Dust Counter Best Value
One listing on this page publishes an accuracy figure and this is it. WapoRich states a PM2.5 range of 0 to 1000 micrograms per cubic metre with an accuracy of plus or minus 12 micrograms per cubic metre, across three channels at PM0.3, PM2.5 and PM10, with temperature included.
That figure deserves reading carefully rather than celebrating. Plus or minus 12 micrograms is a large absolute tolerance at the low end: at a genuinely clean indoor reading of 8 micrograms, the true value could be anywhere from zero to twenty, which is the difference between excellent and mediocre air. At the high end, during cooking or wildfire smoke when readings reach 150 or 300, the same tolerance is a rounding error. So this instrument is well suited to detecting and tracking pollution events and poorly suited to certifying that air is clean. Knowing that is only possible because the figure is published, which is precisely the argument for buying instruments that publish one.
Three channels including PM0.3 gives some of the source discrimination that the six-channel counters offer, at a much lower tier. The 1000 microgram ceiling covers severe smoke events comfortably. No flow rate or sample volume is stated.
Strengths
Range and accuracy both published, unique here
Three channels including the fine PM0.3 end
1000 microgram ceiling covers severe smoke
Lowest tier instrument on the page
Limitations
Plus or minus 12 micrograms is coarse at clean indoor levels
Short answer: the Temtop P600 is the general-purpose choice because it reports PM2.5 and PM10 from a laser sensor and translates them into health bands you can act on; the JCKJEDAT JD 3003 is the instrument for filtration and facility work with six published size channels; and the WapoRich 3-channel counter is the value pick and the only listing here that publishes both a measuring range and an accuracy figure.
Two instruments, two different quantities
The single most useful thing to understand before buying is that mass concentration and particle counts are not the same measurement. An air quality monitor reports PM2.5 as micrograms of particulate mass per cubic metre of air, which is the unit every public health guideline and outdoor air quality index is written in. A particle counter reports the number of particles detected in each size band per sample volume, which is the unit filter ratings, cleanroom classifications and HVAC commissioning are written in. Both instruments usually work the same way underneath, by shining a laser through a sampled air stream and measuring scattered light, but they present the result in different currencies. Converting between them requires assuming a density and a shape for particles that are in reality a mixture of soot, mineral dust, pollen, fibres and condensed oils, which is why the conversion is unreliable and why the table above keeps the two families apart.
What the size channels tell you
A single PM2.5 figure is a total, and totals hide causes. Four instruments here state six size channels covering 0.3 to 10 micrometres, and that structure is diagnostic. Combustion produces very fine particles clustered at the bottom of the range, so cigarette smoke, cooking fumes, candles, wood stoves and wildfire smoke all load the 0.3 and 0.5 micrometre channels heavily. Mechanical processes produce coarser particles, so sanding, cutting, sweeping, soil disturbance and pollen load the 3, 5 and 10 micrometre channels. Seeing which end of the distribution is elevated tells you which kind of source you are dealing with before you go looking for it, and it also tells you whether filtration will help, since filters are rated by their efficiency at specific particle sizes and the hardest particles to capture sit near 0.3 micrometres. Our guide to using a monitor with an air purifier covers the follow-through.
Reading the one accuracy figure on this page
WapoRich states plus or minus 12 micrograms per cubic metre for PM2.5. It is worth working through what that means, because it is the kind of figure buyers either ignore or over-interpret. During a serious smoke event, with readings of 200 or 300 micrograms, a 12 microgram tolerance is irrelevant and the instrument is entirely fit for tracking the event and the recovery. In clean indoor air at 8 or 10 micrograms, the same tolerance spans the entire meaningful range, and the instrument cannot distinguish very good air from mediocre air. Neither observation makes it a bad instrument; both make it a specific one. The nine listings that publish no accuracy figure have the same characteristic somewhere in their specification, but you cannot know where. That is the whole argument for weighting published figures heavily even when the published figure is modest.
Where and how to measure
Particles behave very differently from gases and placement matters far more. Carbon dioxide mixes through a room within minutes; particles have a source, a plume and a settling time, so a monitor two metres from a frying pan and one in the next room will disagree by an order of magnitude and both will be correct. For tracking a household exposure, put the instrument where people actually are and leave it there. For finding a source, carry a handheld counter and walk, watching the fine channels rise as you approach. Keep the inlet clear of obstruction, do not place the device where an air purifier discharges directly at it, and give the sensor a minute to stabilise after moving it. For smoke season specifically, our guide on choosing a monitor for wildfire smoke covers the range and response characteristics that matter.
For a home where the concerns are cooking, smoke and the occasional bad air day, buy a mass-reading monitor with clear interpretation and leave it in the room you use most. For renovation, woodworking or any job that makes dust, buy something with channels so you can tell what you are making and whether extraction is working. For facility, HVAC or cleanroom work, buy a counter, and confirm the flow rate and sample volume with the manufacturer, because without those the counts cannot be compared with anyone else’s.
How We Research
Instruments were compared on manufacturer listing text: the size channels each listing states, measuring range, any published accuracy figure, the quantity reported, battery and portability, and any additional parameters. Products that report particle counts are separated from those that report mass concentrations, because the two are different measurements and are not interconvertible in any reliable way. No listing states a flow rate or sample volume, so counts between instruments are not directly comparable and we do not present them as if they were. We ran no comparisons against reference instruments and publish no measurements of our own. Amazon data supplies images, availability and links only.
A handheld particle counter can indicate whether a room is likely to be within a guideline but cannot demonstrate compliance, because published limits are averages over hours or classifications with defined sampling plans and traceable instruments.
Most disagreement between two particle monitors in the same room comes from the two instruments sampling different air, different calibration aerosols and different humidity response, rather than from one of them being broken.
A smallest channel of 0.3 micron is an optical limit rather than a physical one, and the particles below it are invisible to the instrument while often outnumbering everything it does count.